
I know little blog, you are not getting the attention you deserve. Neither is the are-you-ok device. I’m spending a lot of time working and a lot of time with my podcast.
Speaking of my podcast, several people have recently asked for statistics on the listeners. It would make more sense if said people were offering me money (i.e. sponsorships) but because the podcast is sponsored by our consulting company (Logical Elegance), I haven’t bothered to figure out how to make sponsorship work. And if it is this annoying, I may never bother.
Anyway, I decided to sit down and figure out the statistics. And write a paper-let for potential non-sponsors. (Why? Why? I really do have useful things to do but this is what I did.)
Determining traffic is very difficult, particularly as producer Chris and I do the podcast as a hobby, not as a business. However, I’ll try to give you some ideas to help you decide if this is a good media outlet for you.
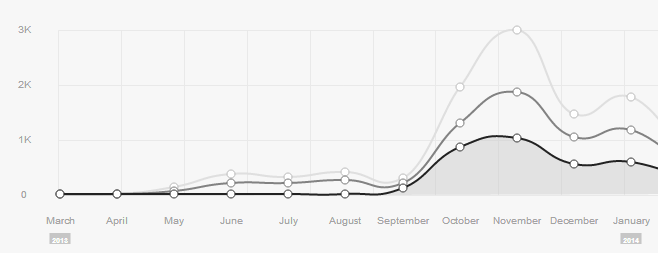
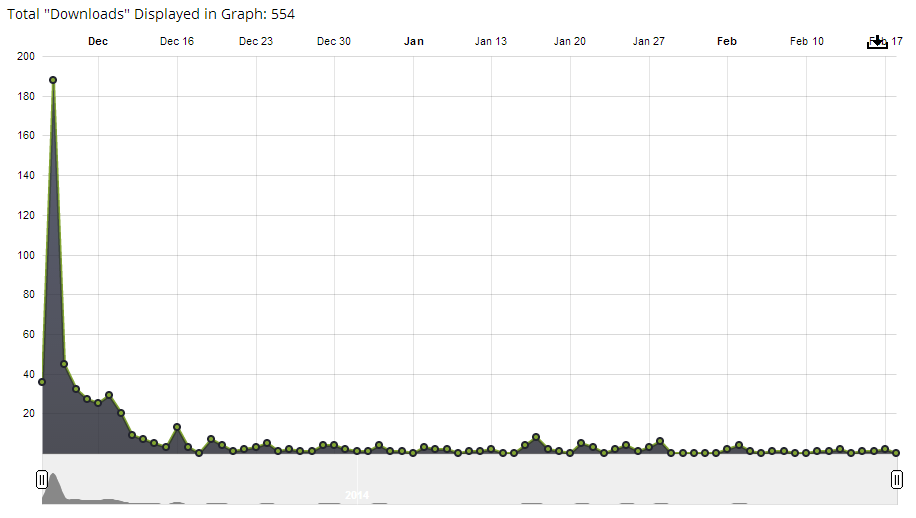
This is our traffic to embedded.fm over the life of the podcast. Most people hear about the show and visit embedded.fm.
However, once they’ve heard about the show, they use a podcast app to listen regularly, such as iTunes, Instacast, Stitcher, or Zune. For the ones that use RSS (iTunes, Instacast), libsyn provides the statistics of episodes downloaded. (Zune and Stitcher are used by less than 5% of listeners.)
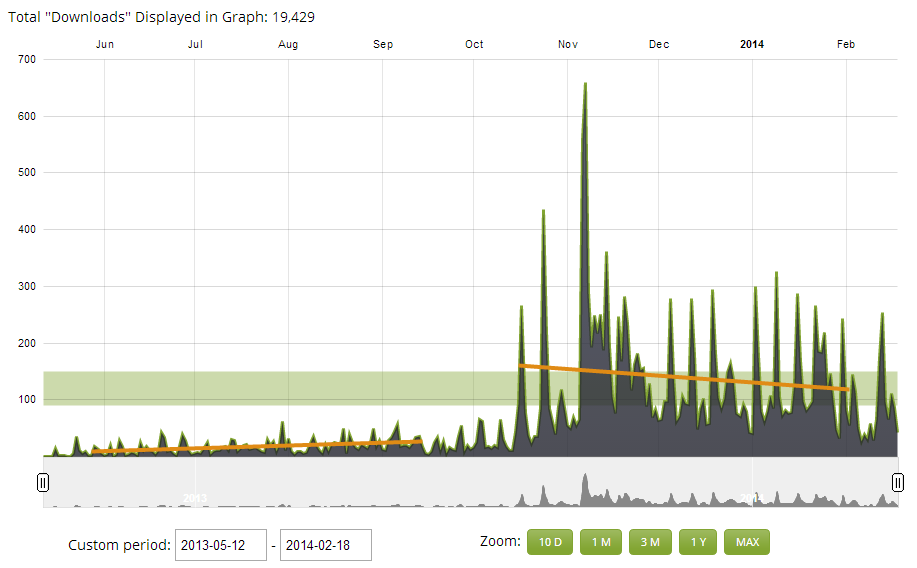
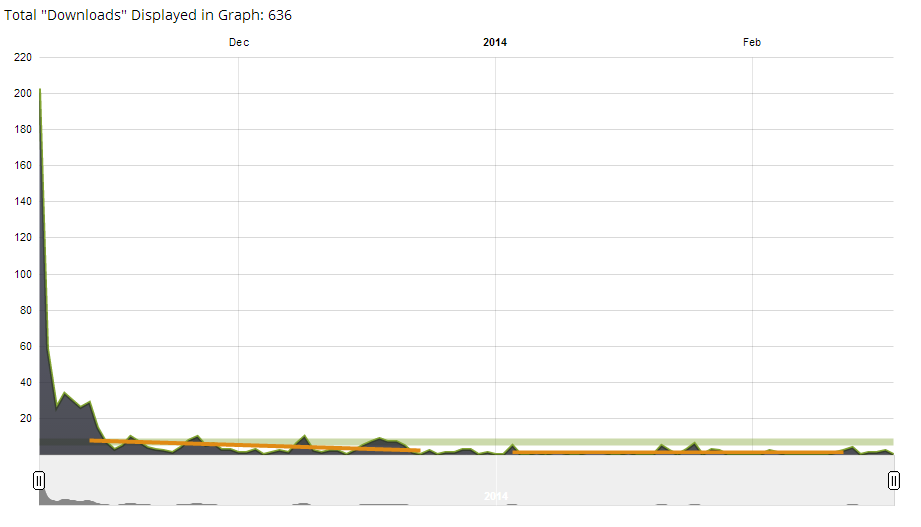
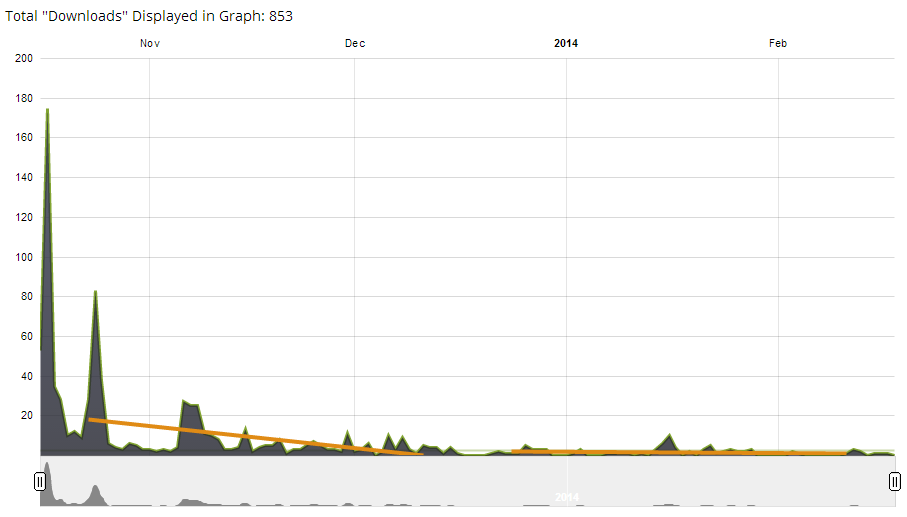
I find the graph a little hard to read, though the orange trendlines do show a week-to-week consistency. Looking at the monthly numbers, you can see that there was a bump in November when Jeri Ellsworth’s show came out (and my show was mentioned on The Amp Hour).
| Year-Month | Month | Year | Total Downloads |
| 2014-01 | January | 2014 | 4,160 |
| 2013-12 | December | 2013 | 3,558 |
| 2013-11 | November | 2013 | 5,700 |
| 2013-10 | October | 2013 | 2,216 |
| 2013-09 | September | 2013 | 656 |
| 2013-08 | August | 2013 | 608 |
| 2013-07 | July | 2013 | 507 |
| 2013-06 | June | 2013 | 383 |
| 2013-05 | May | 2013 | 122 |
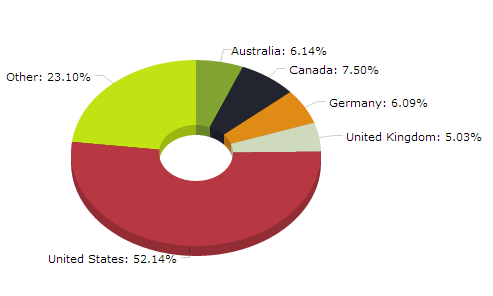
Geographically, the listeners come from around the world, though mostly English speaking countries.
Looking at a few specific episodes, the numbers depend on many factors. I don’t know what they are, some of it is guest promotion but a large part is simply how interested the market is in the topic.
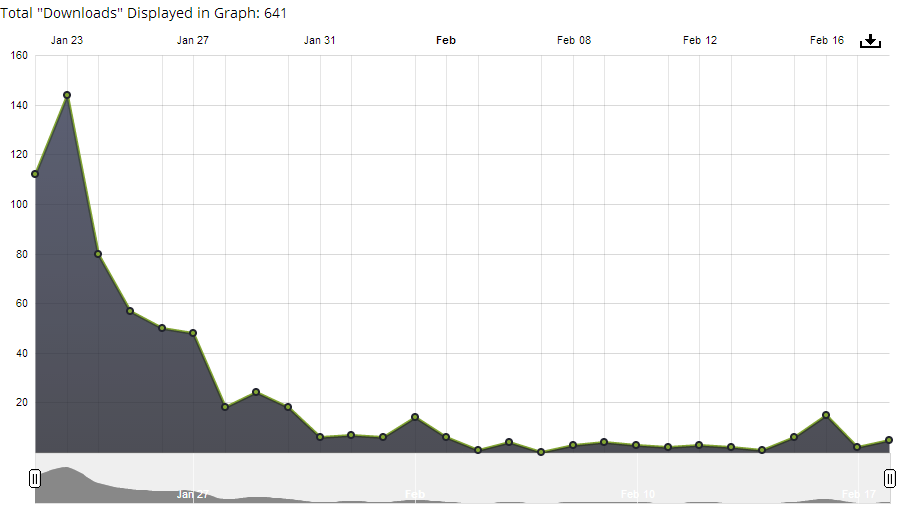
Episode 36: Drive your boat with a Wii mote. Saleae founder talks about the Saleae Logic
Episode 29: Ducking the Quadcopter. Microgen Systems VP of Engineering talks about energy harvesting.
Episode 26: The tofu problem. Deeply technical discussion on internationalization of embedded devices.
Episode 23: Go for everything I want. Jeri Ellsworth talks about CastAR and Valve.
Finally, I can’t speak to the specific breakdown of the audience, from the emails I receive, it is primarily hardware and software engineers.


